Whether you’re a seasoned investor or just dipping your toes into the financial waters, this feature will empower you to make informed decisions about your investments.
The Forecast features consists of 3 different methods to forecast your portfolio and each method has different uses:
Non-Compounding Method
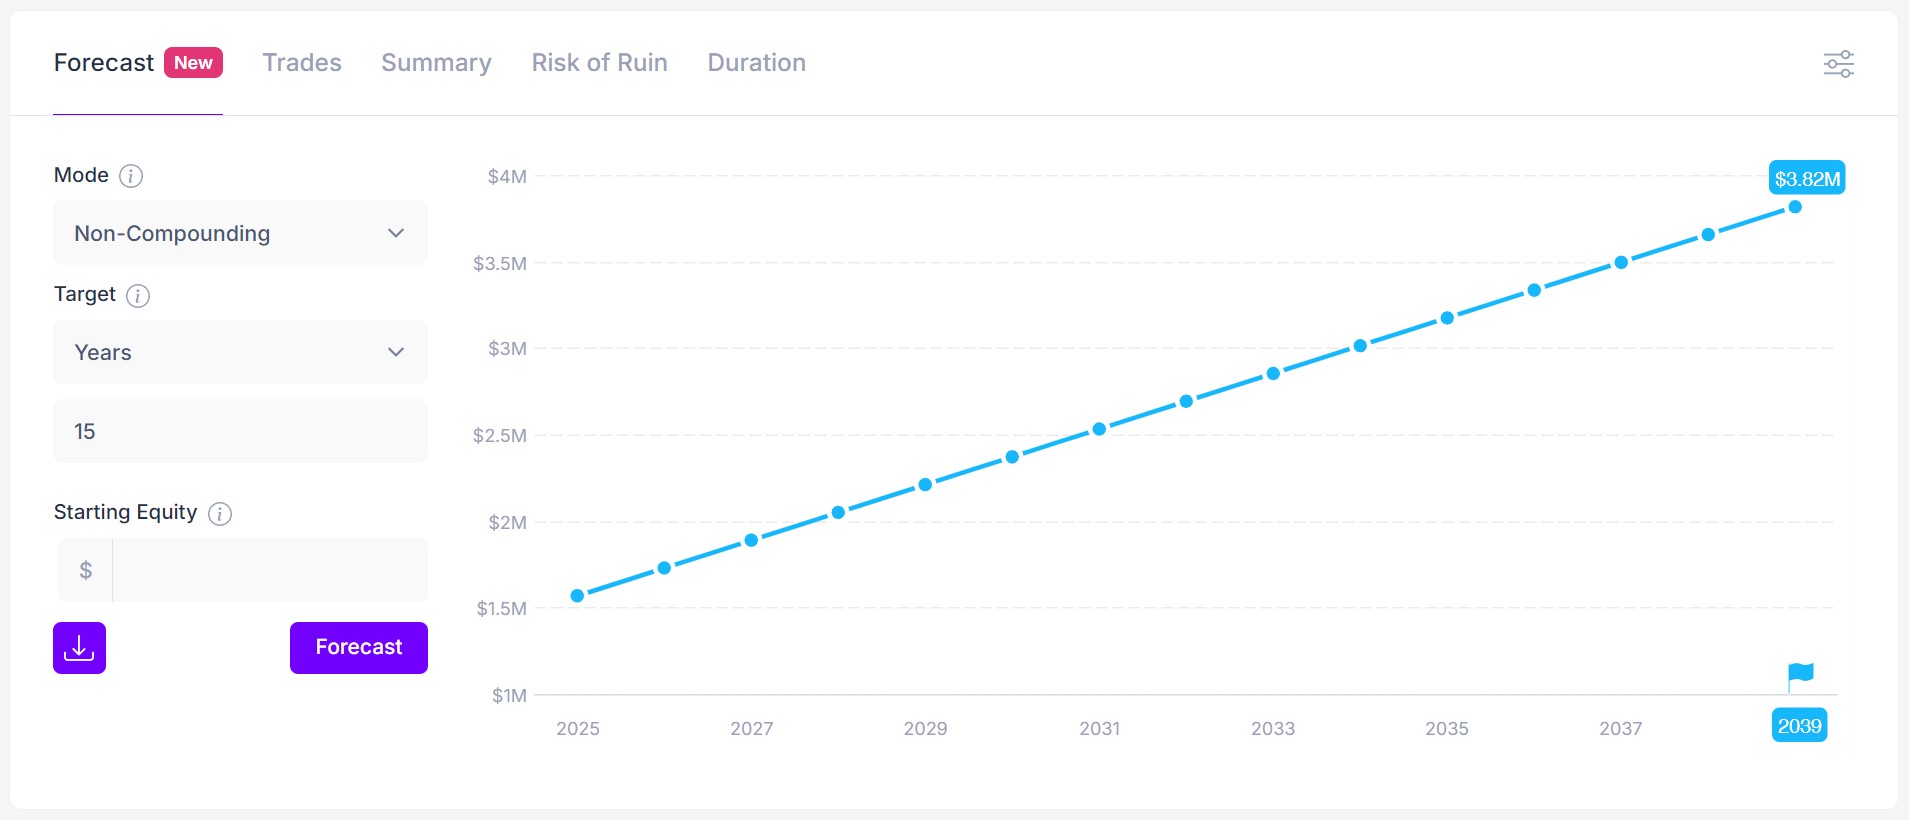
What it does: The non-compounding method provides a straightforward projection of your portfolio’s growth. It assumes that any gains (or losses) you make each year are not reinvested but instead remain static.
When to use it: If you prefer a conservative estimate or want to see a baseline scenario without the effects of reinvestment, this method is for you.
Compounding Method (available in Plus plan)
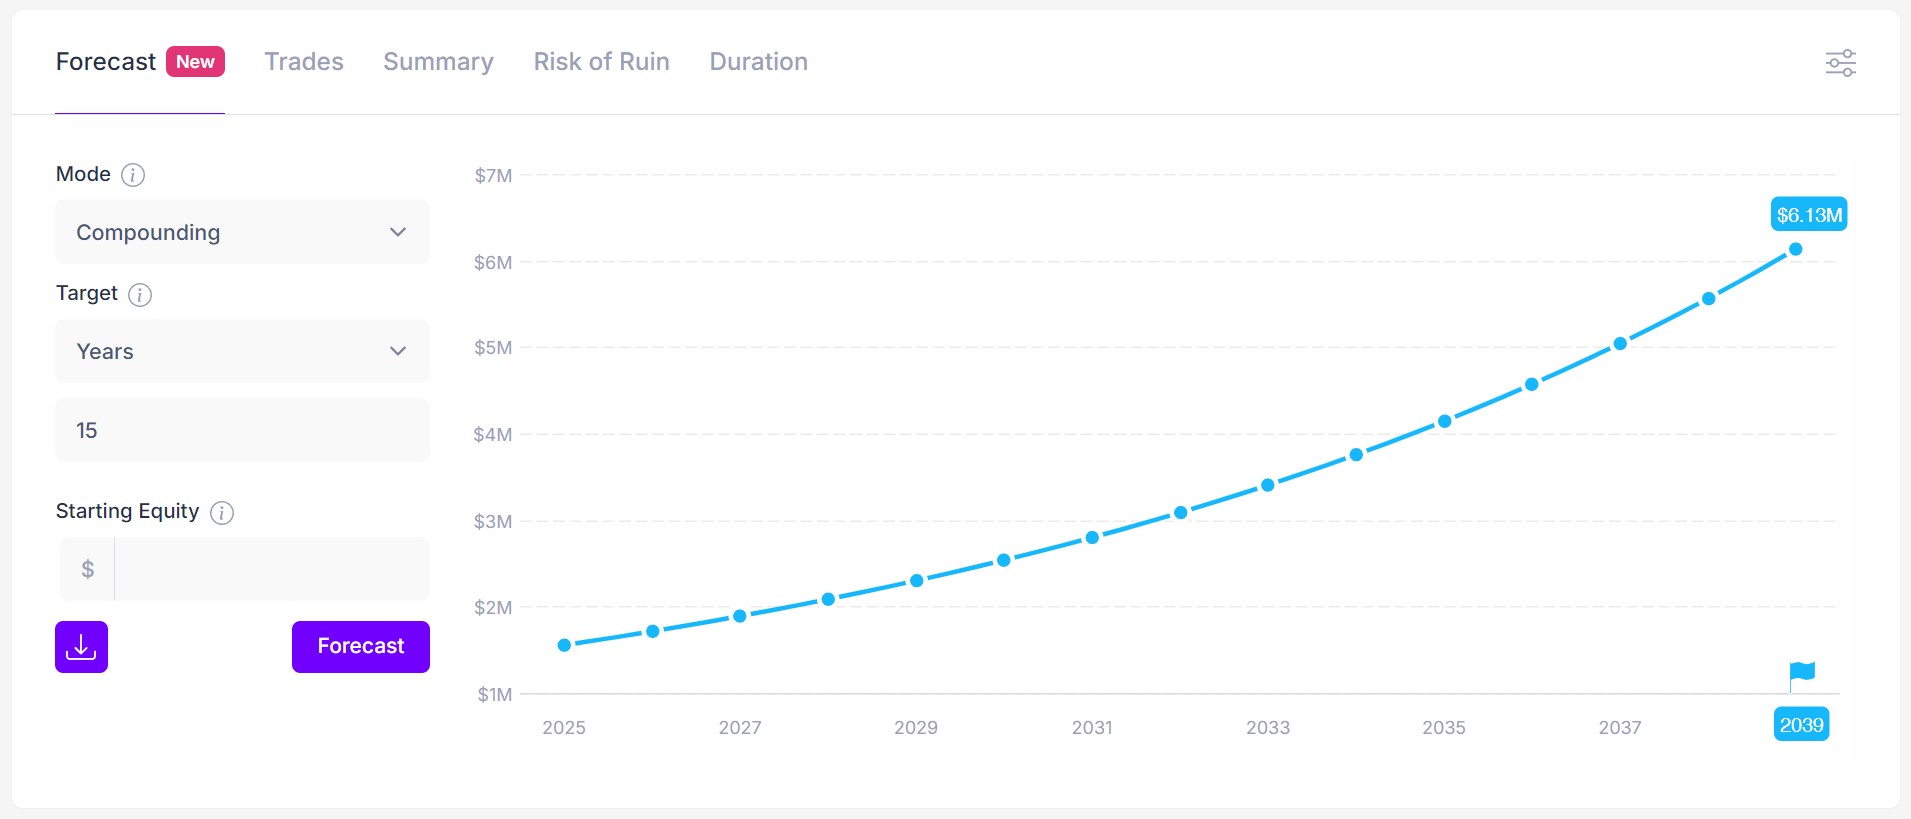
What it does: Compounding is the magic ingredient in long-term wealth building. This method factors in reinvestment of gains. As your portfolio grows, it compounds – earning returns on previous returns.
When to use it: If you’re in it for the long haul and want to see the compounding effect over time, this method is your go-to.
Monte-Carlo Method (available in Pro plan)
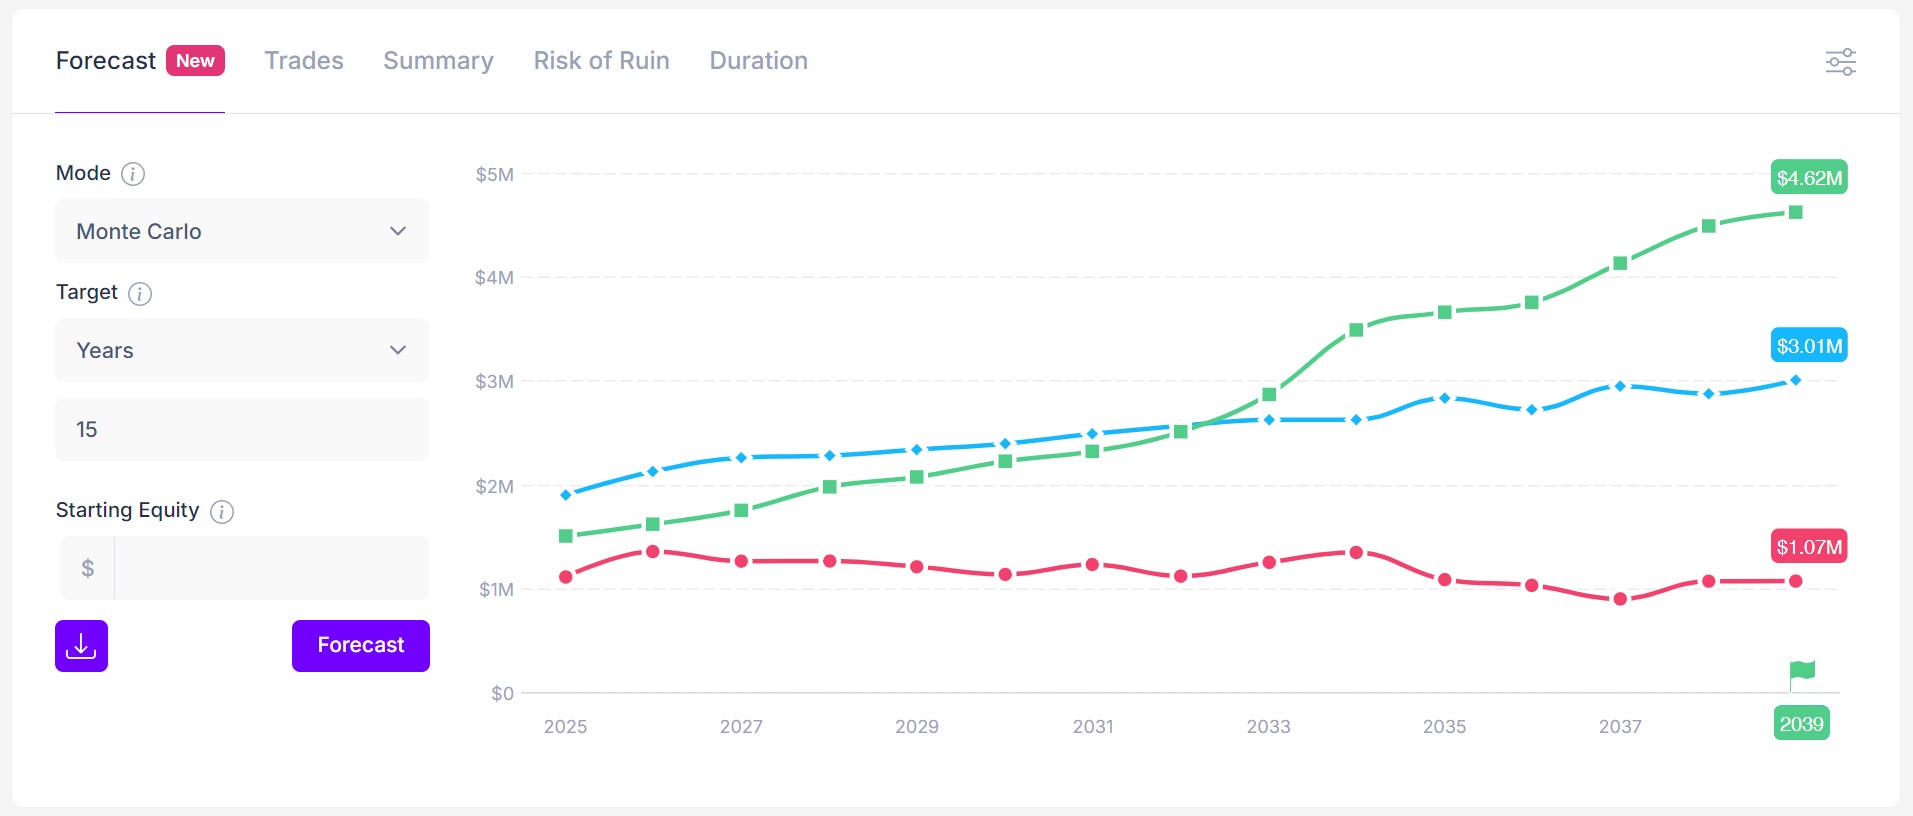
What it does: Buckle up! The Monte Carlo simulation takes portfolio forecasting to a whole new level. It considers randomness, market volatility, and countless scenarios. By running thousands of simulations, it gives you a distribution of potential outcomes.
When to use it: When you crave a realistic view of uncertainty—because life isn’t a straight line. Worried about market crashes? Curious about best-case and worst-case scenarios? Monte Carlo’s got your back.
How to use the forecast settings?
You can target different metrics such:
- Years – what will happen in x years.
- Equity – when the portfolio reaches equity $x.
- Profit – when the portfolio reaches profit $x.
- Gain – when the portfolio reaches a gain of x%.
Moreover, you can use a custom growth rate (instead of the current portfolio) as well as different starting equity to test different scenarios.
You can customize the chart by using the options at the top right corner to view the forecast chart in different formats:
- Equity chart
- Profit chart
- Growth chart
- Cumulative chart
- Yearly chart
Finally, once the forecast is generated, whether you want to keep it for reference purposes or share it with your fellow traders or anyone else, just hit the download icon to save the forecast as an image.
Remember, these forecasts are tools—not predictions. Markets can surprise us, and life throws curve-balls. But with these features, you’ll be better equipped to plan, adjust, and stay on course.
Disclaimer: The information provided in portfolio forecasts is for educational purposes only and should not be considered financial advice. Consult a qualified financial advisor before making any investment decisions.